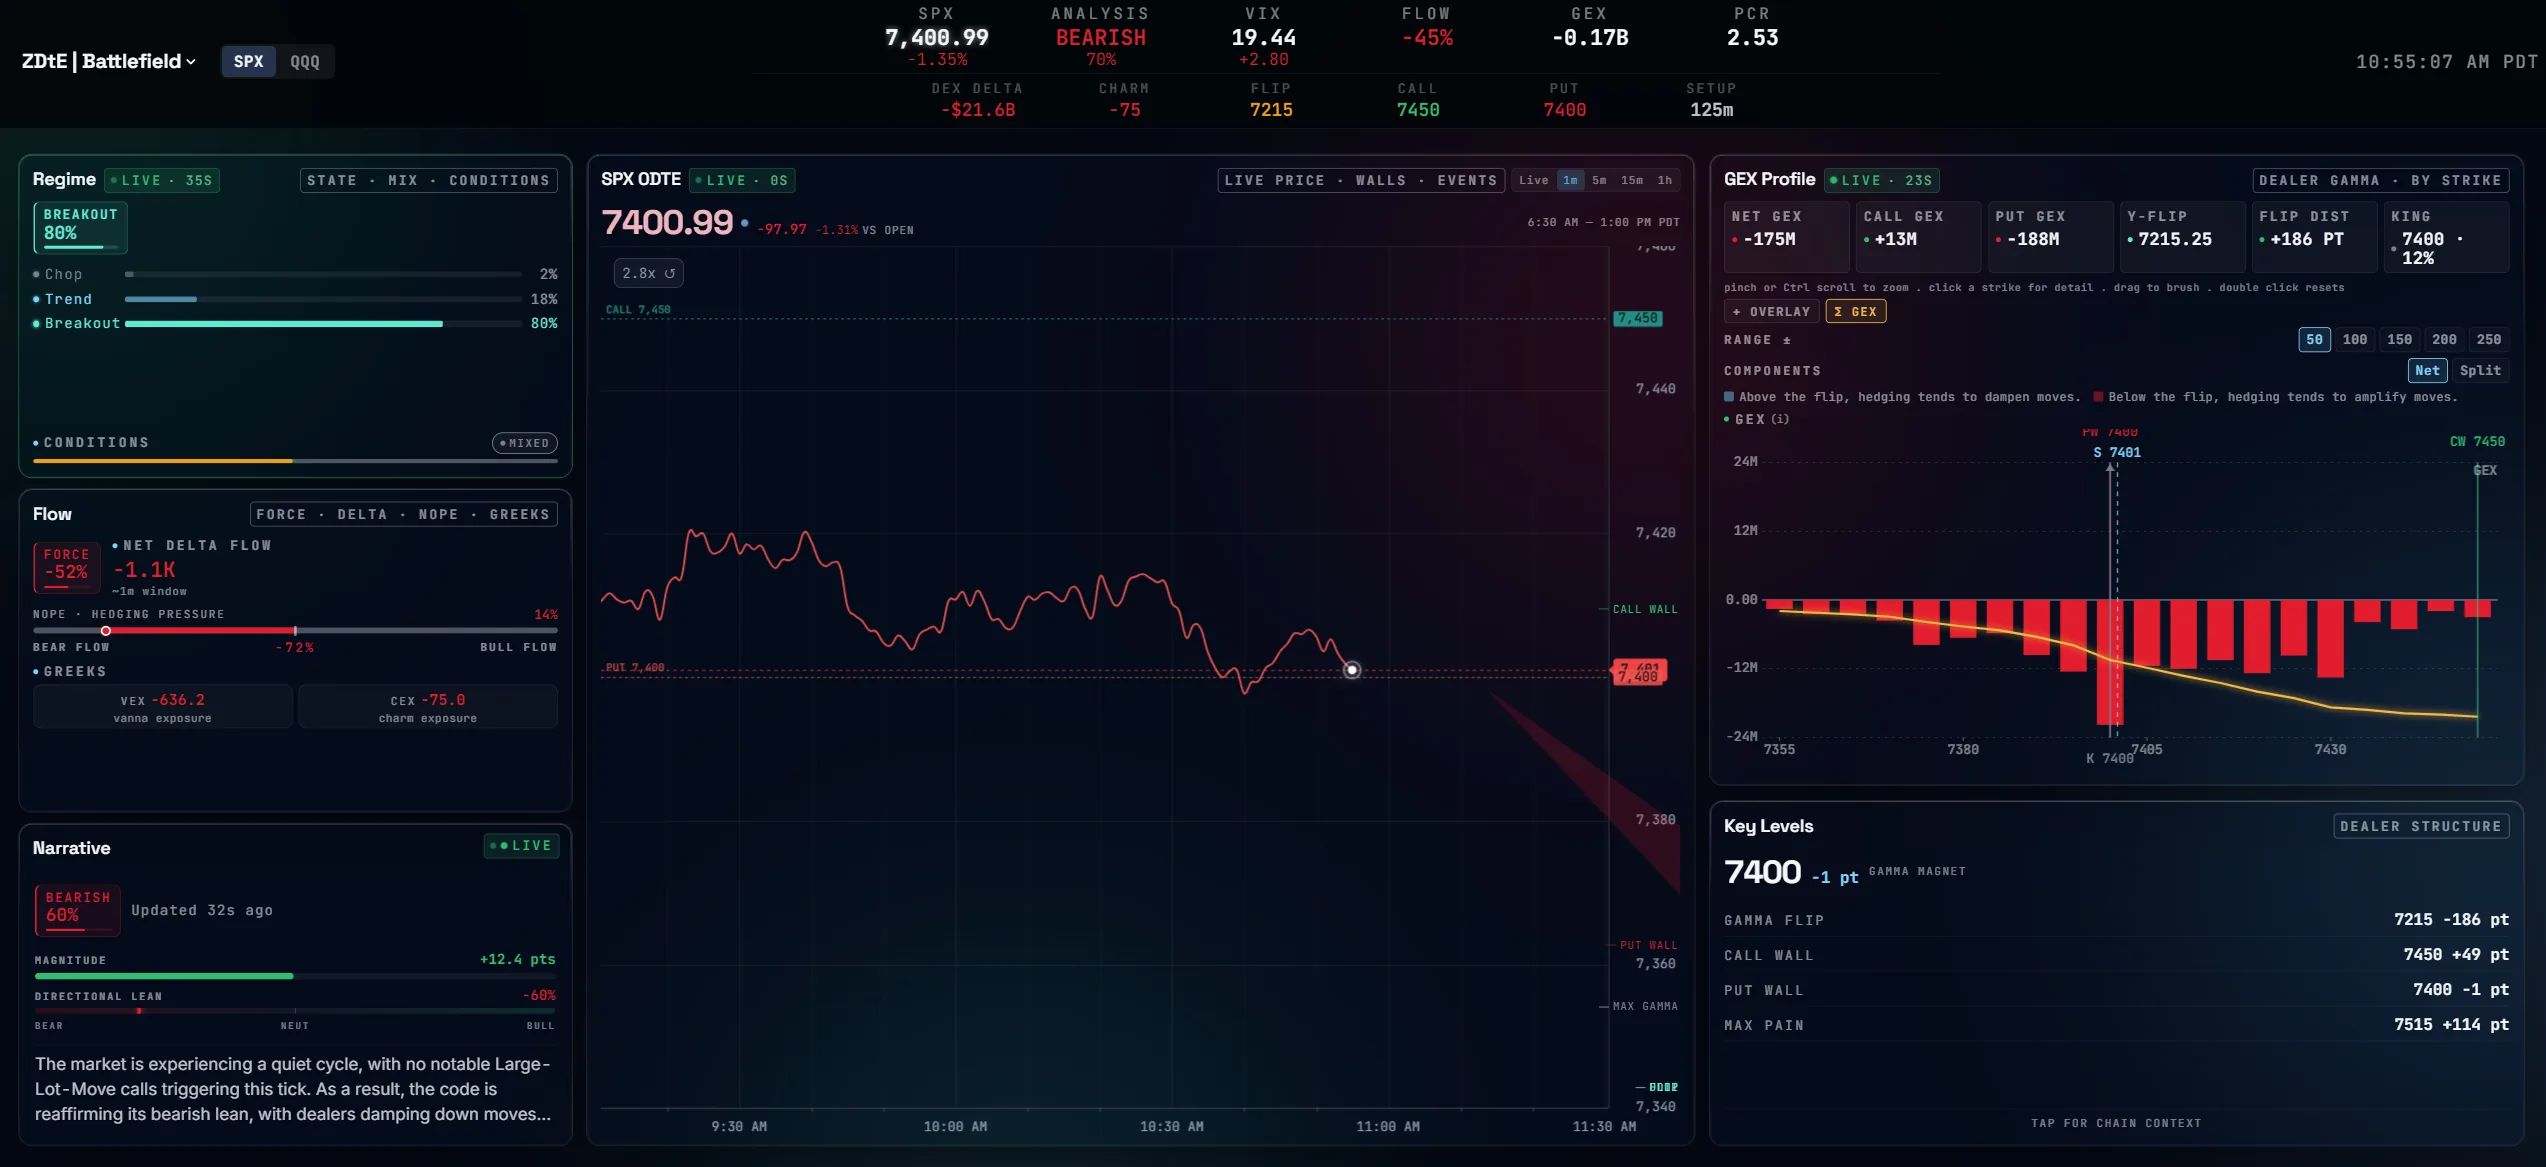
6.5 hours of dealer positioning compressed into a glance. Pressure walls, flow events, the cursor that walks the day. Free, on this page, every night.
REPLAY6.5h in 45sSPX 0DTE
SPX
—
▲+0.00%
Range
—
—
Loading replay…
9:3011:0012:3014:0015:30
Price▲Bull▼Bear
Replaying previous session
<5s
Stream to screen
100%
Of the chain, every refresh
0
Indicators
0DTE
Native, end to end
The Battlefield
One deck. Three pages. The whole session.
The full dealer-positioning picture in a purpose-built cockpit - decision first, depth on demand.
Regime, flow, and the reading beside the live chart - the glance that answers 'is there anything here right now?'
The Reading
The session, in plain English.
Under every page, a continuously updated one-line reading of what the positioning data shows right now. Descriptive, not predictive.
READING LIVE
Spot 7,560 sits between a tight wall pair - put wall 7,550, call wall 7,570 - at 90% of session range. Mid-range chop with no live directional edge.
Refreshed all session · every reading is time-stamped
Traces to data · every claim maps to a level on screen
Never advice · describes structure, decides nothing
Depth on Demand
Strike-level everything.
When the glance is not enough - every surface opens to strike level.
▦ GEX Profile
Where the magnets sit.
Call walls, put walls, flip points. Surfaced live with confidence-weighted ranking.
◢ Greeks by strike
Delta, vega, theta - the way a desk reads them.
Eight Greek surfaces, per strike, updating with the tape - the pressure behind every level on the board.
◈ Alerts & watchlists
Quiet until structure moves.
Wall moves, regime flips, and outsized prints - surfaced the moment they land.
12:41WALLCall wall moved 7570 → 7580
11:58REGIMEClassification: CHOP → TREND
10:24PRINT$2.4M sweep at 7565C
◐ Volatility, plainly
Skew, smile, IV vs RV.
The vol surface behind the session, readable at a glance.
What The Desk Sees
Six things the desk has had for years. Now you do too.
Dealer positioning. Gamma walls. Dark prints. Regime classifications. The same options data institutions reference, displayed for self-directed traders.
01
Institutional-grade options data, in real time.
Every print, every wall, every regime classification, pushed to your screen within seconds of the exchange. Direct feed, not delayed and not derived. The same structural view the desks watch, now on your screen, for informational and educational reference.
02
Positioning data, displayed alongside price.
Most charts show price and indicators built from price. Our terminal also displays dealer positioning data: gamma walls, dark prints, vanna ramps. The structural options data, visualized alongside the tape in real time, for informational and educational reference.
03
Greeks the way a market maker reads them.
Gamma walls. Vanna ramps. Charm decay. Rendered as shapes on the strike grid, the way an MM looks at positioning at a glance. Not the way a textbook teaches you to solve for it.
04
Every line traces to a print.
Every displayed level traces back to observable exchange data. Tap any wall, any zone, any line on our terminal. We show you the underlying trade. Size, time, side, exchange. Transparent analytics. Not a black box.
05
Quiet by default.
Notifications surface when observable positioning data crosses our defined thresholds, not on routine indicator flips or volume blips. Most days, the terminal stays quiet. That’s the design.
06
You decide. Not us.
We display the analytics. Regime classifications, positioning data, model confidence estimates, risk context. Then we stop. The terminal will never place a trade for you. We surface the data. You make the decision.
Pricing
Two tiers. No theatrics.
Thirty days of the real thing, free. After that, Pro is where the live data lives.
30-DAY PRO TRIAL
Every new account starts with full Pro access for 30 days. After that, keep Pro or drop to Free - your call.
Core
Free
$0/mo · forever
Demo session - the full product on a frozen snapshot
No. ZDtE.AI is educational analytics. We surface dealer positioning and institutional flow; you make the trade. Nothing on this site or in the product constitutes a recommendation.
Pro data lands on your screen within five seconds of the source. Every panel shows its own freshness indicator.
SPX 0DTE, end to end. Additional instruments are on the roadmap; we ship them when the data meets the same bar, not on a promised date.
Every new account starts with full Pro access for 30 days - no card required. When the trial ends you drop to Free automatically; upgrade any time to keep the live stream.
A demo session on a frozen snapshot - the full product, not live data - plus yesterday’s full session replayed every night, the Learn library, and the community Discord.
Yes. Monthly plans cancel at the period end with one click; annual plans get a prorated refund within 14 days.
No. We don’t sell, broker, or share user data. Your queries stay between you and the engine.
SPX, analyzed in real time.
Two minutes to set up. Free forever on the core tier.